Add a new YSQL analyzer
Description
When there are abnormal HTTP requests or increased latency, operation engineers need to locate the problem in a timely manner. This is the time to get more information about the request. Traditional methods include analysis of logs, packet analysis, etc.
Log analysis is limited by the number of configured log fields and cannot necessarily be used to locate problems. Because logs are often captured to other systems for analysis, log fields cannot be modified at will.
Most of the production is HTTPS requests, and the packets are already encrypted. Packet capture analysis cannot go deeper into the HTTP content. Therefore, packet capture analysis can get very limited information.
In this case, you can use YSQL to quickly create an analysis tool to get the information you need about the request.
The YSQL tool exits after 3s of execution by default and samples up to 1000 requests.
Add a new YSQL analyzer
The following YSQL statement will filter out all HTTP requests with a status code greater than 200 and output a collection of request URIs and status codes.
select count(*), uri, status
from ngx.reqs
where status > 200
group by uri, status;
Executing the tool gives the following results:
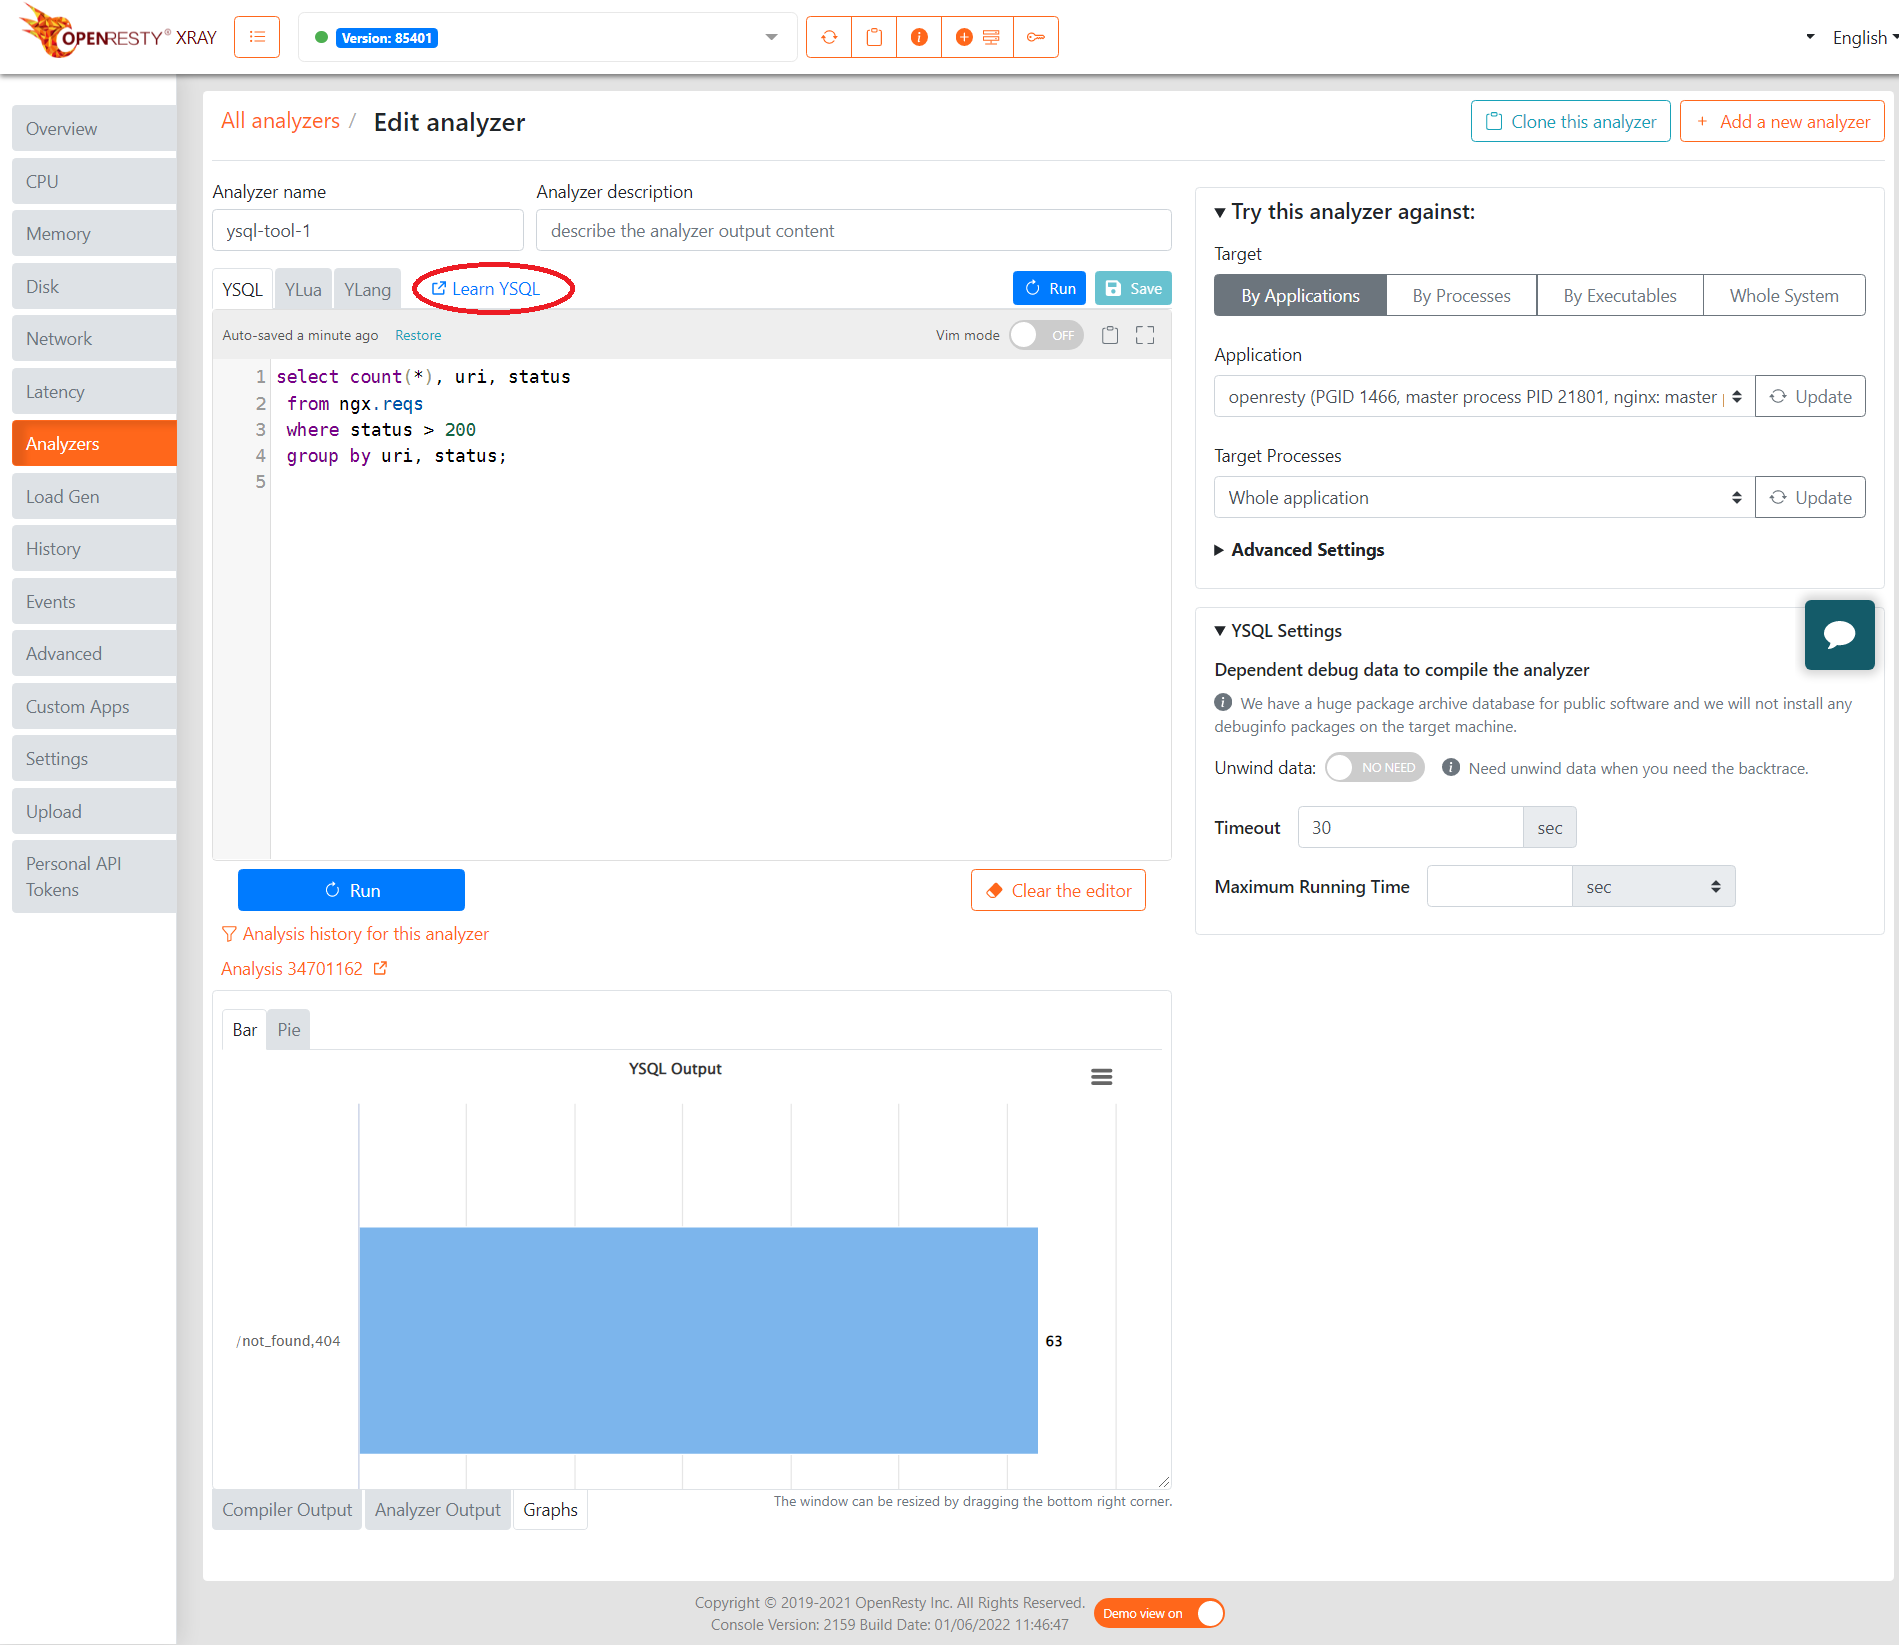
To the right of the YSQL tab is the Learn YSQL shortcut link to the YSQL user manual. Users can click on the link for a description of YSQL syntax and features.