Core Dump Custom Analysis
We provide standard analyzers that may not be suitable for closed-source applications written by users. In these cases, you need to use custom analyzers to perform core dump analysis. This article will introduce how to use YLang to write custom core dump analyzers.
Preparation
Here we take a simple C program as an example, which will cause a core dump due to a division by zero exception.
#include <stdio.h>

struct Foo {
  char a[10];
  int b;
  float c;
};

int foo(struct Foo *args)
{
    // segment fault
    return 1 / args->b;
}

int main()
{
    struct Foo args = {"foo", 0, 1.0};
    foo(&args);
    return 0;
}
Save the above C code as test.c file, compile and execute it with gcc.
You need to add the
-goption when compiling, otherwise, we will not be able to get debug symbols from the compiled binary file.
$ gcc -g test.c
$ ./a.out
Floating point exception (core dumped)
If you can’t find the generated core file, please check your
ulimitandcore_patternsettings.
Analysis
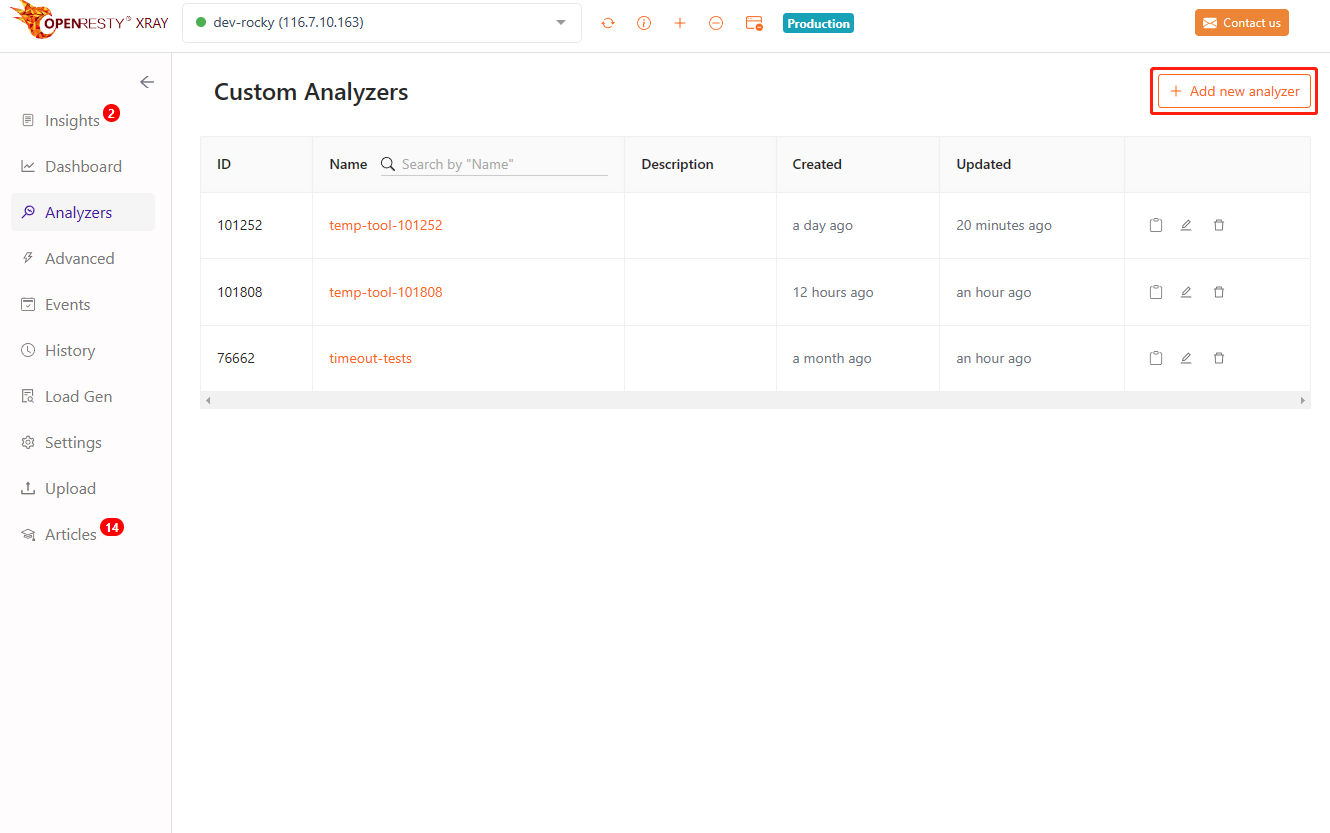
Select the Analyzers page, and click Add new analyzer button.
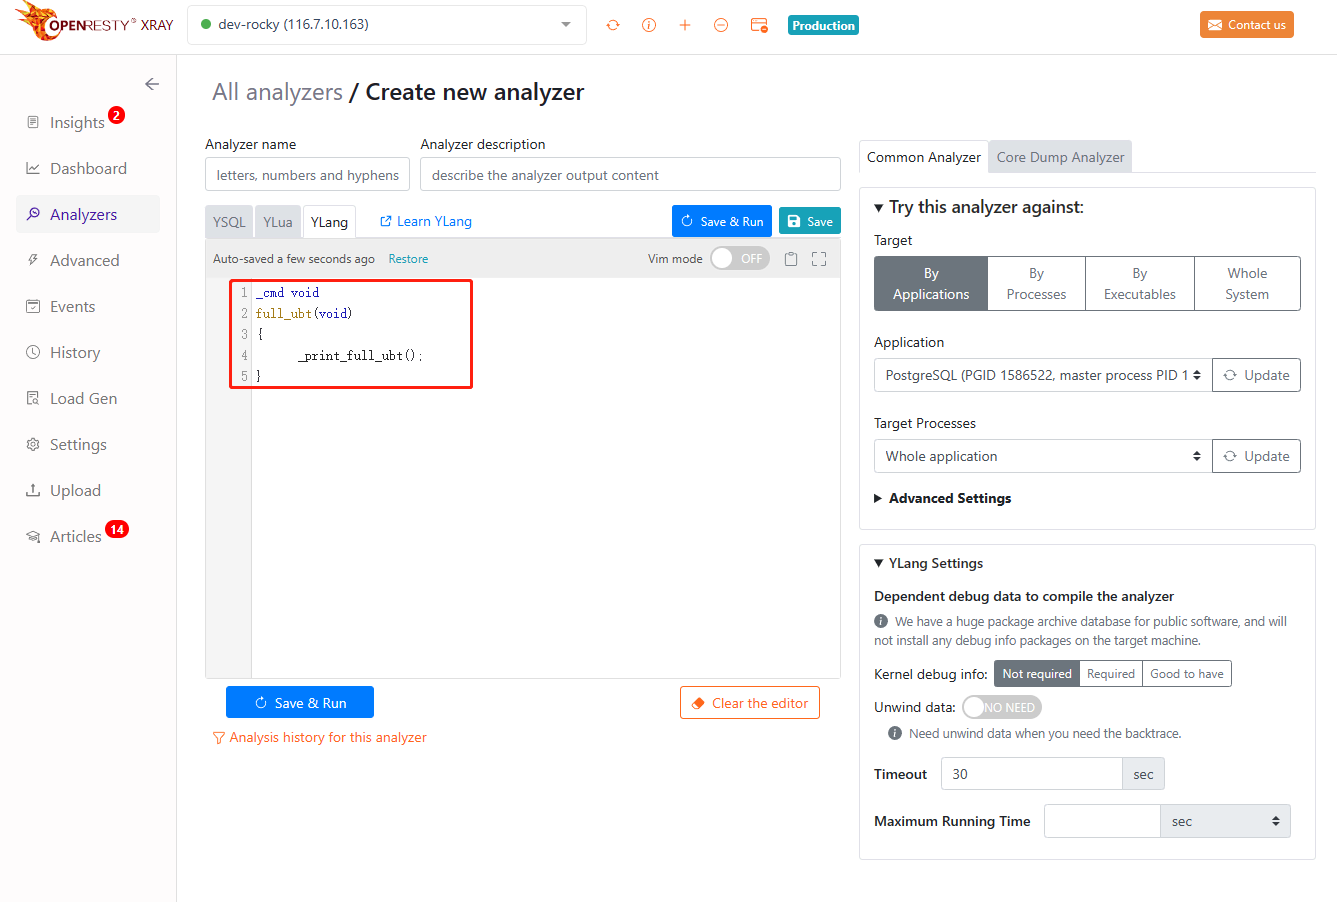
Select YLang, and fill in the following code:
_cmd void
full_ubt(void)
{
    _print_full_ubt();
}
The above code defines a command function that prints the current call stack and argument address.
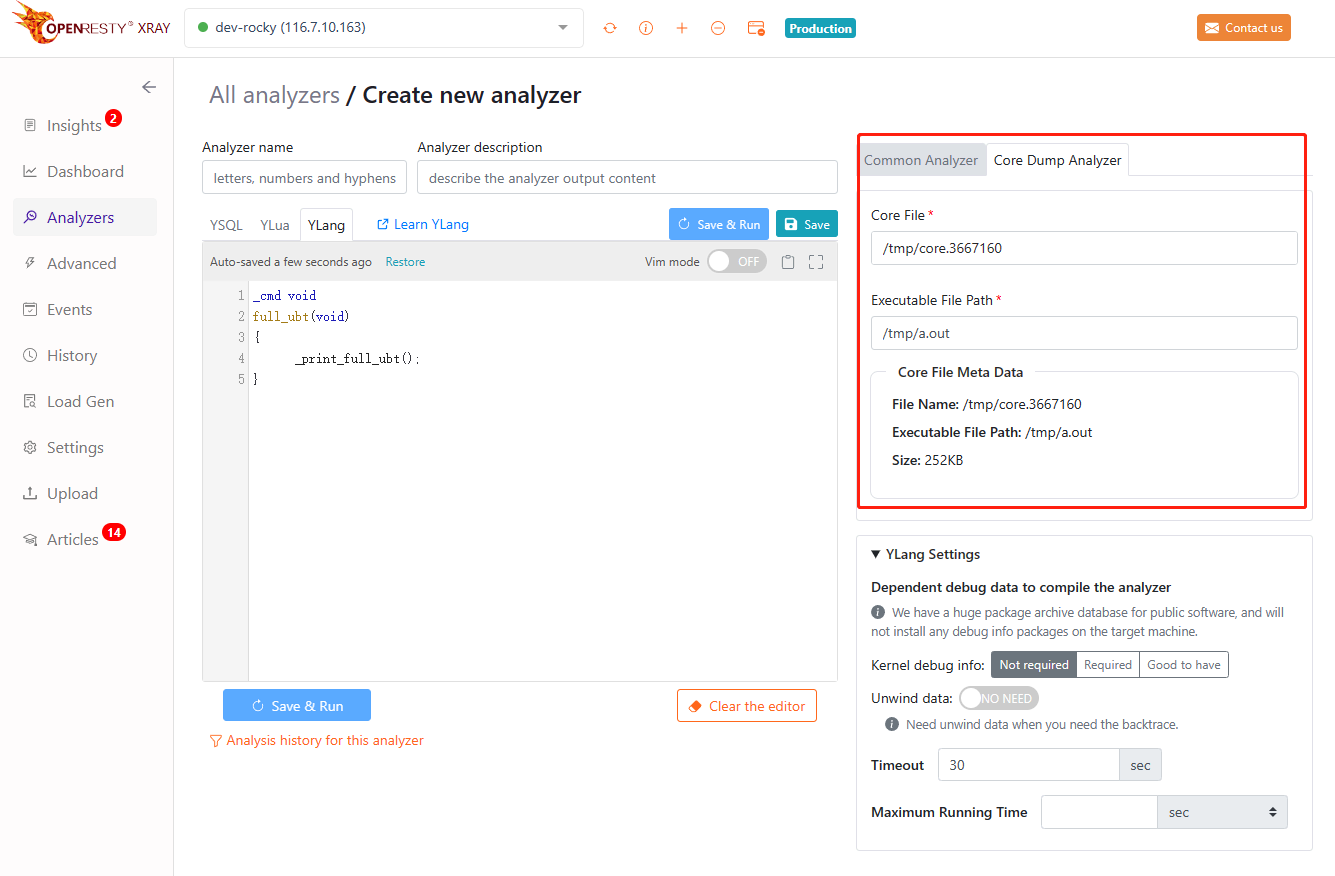
Select Core Dump Analyzer on the right and fill in the address of the prepared core file.
Click save and run to get the result of the corresponding command output.
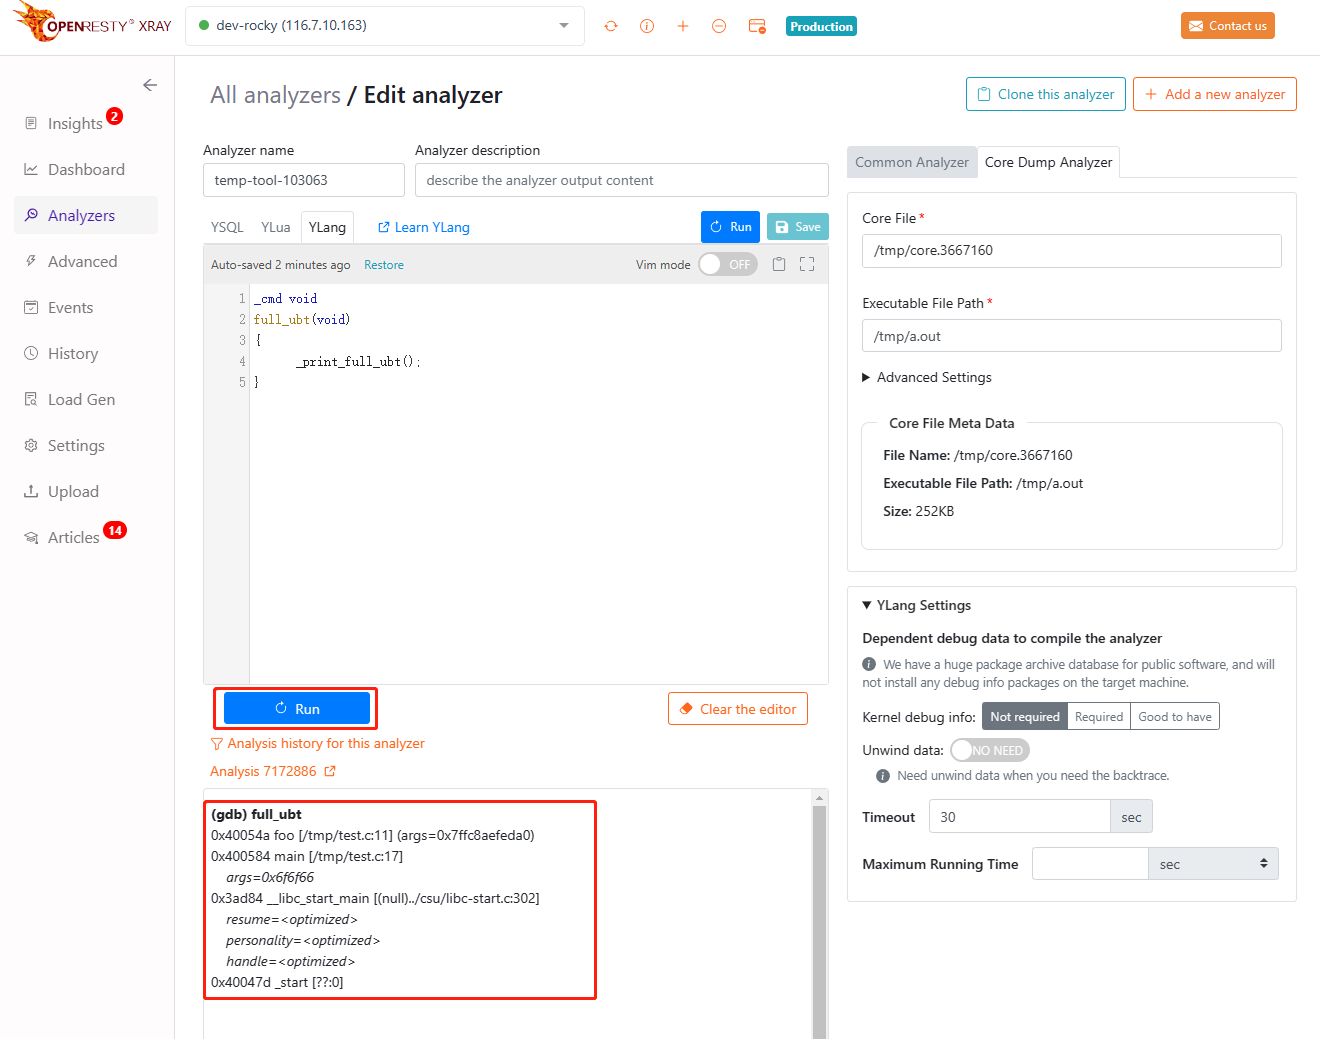
(gdb) full_ubt
0x40054a foo [/tmp/test.c:11] (args=0x7ffc8aefeda0)
0x400584 main [/tmp/test.c:17]
    args=0x6f6f66
0x3ad84 __libc_start_main [(null)../csu/libc-start.c:302]
    resume=<optimized>
    personality=<optimized>
    handle=<optimized>
0x40047d _start [??:0]
We can see that the analyzer prints out the current call stack with the line number information and the address of the args argument 0x7ffc8aefeda0. Based on the line number /tmp/test.c:11 and the code analysis, we can see that the value of args->b is 0 which causes the exception. To verify this, by getting the address of the args argument, we can use the analyzer to print out the value of the variable b inside.
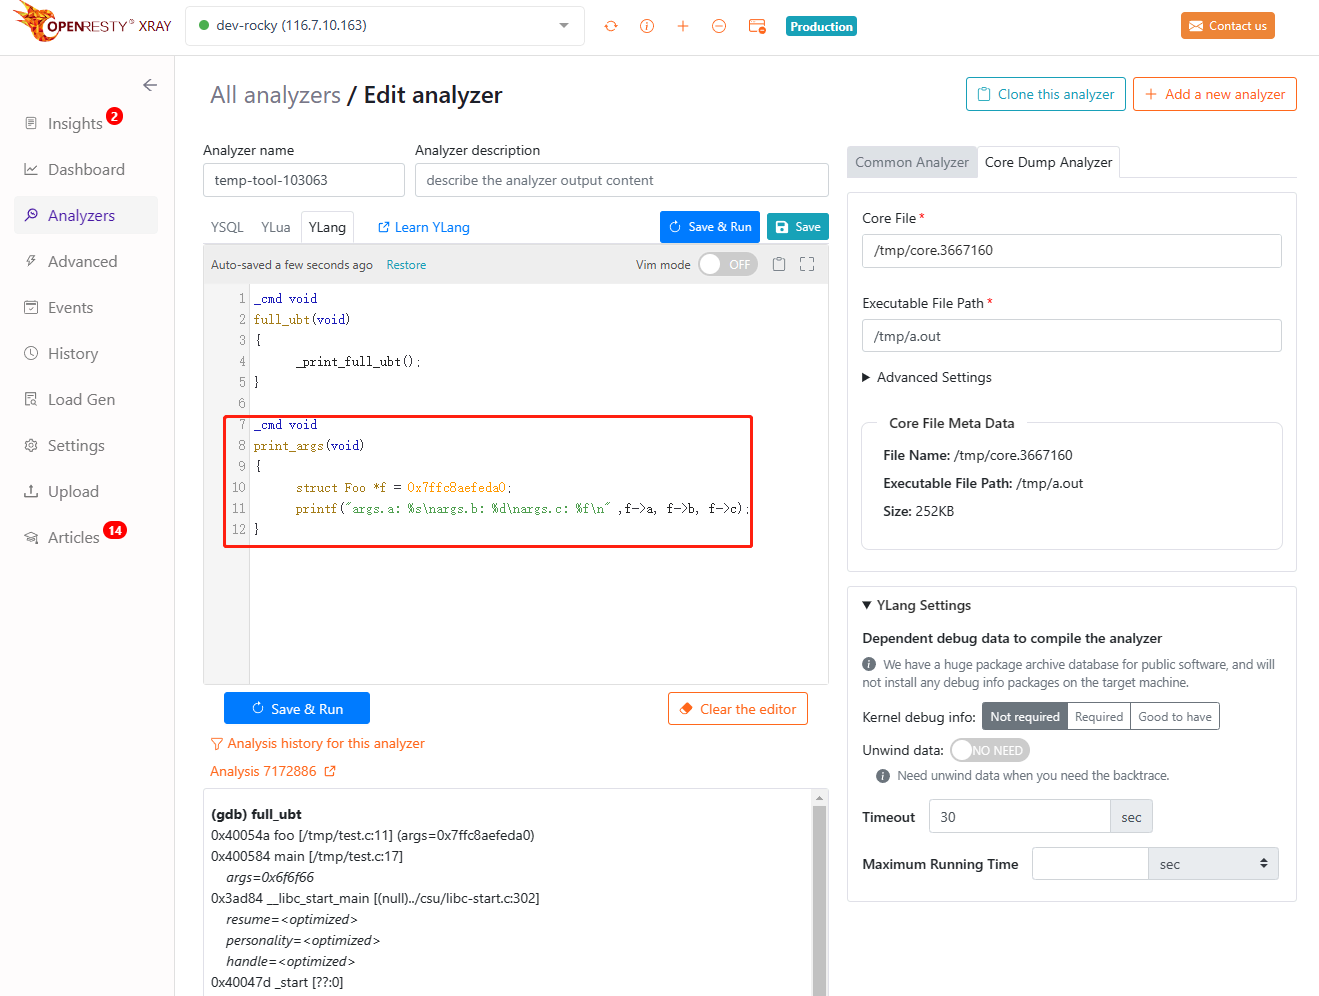
_cmd void
full_ubt(void)
{
    _print_full_ubt();
}

_cmd void
print_args(void)
{
    struct Foo *f = 0x7ffc8aefeda0;
    printf("args.a: %s\nargs.b: %d\nargs.c: %f\n" ,f->a, f->b, f->c);
}
The YLang code above adds a print_args command function to the original, which prints the values of the member variables in the structure.
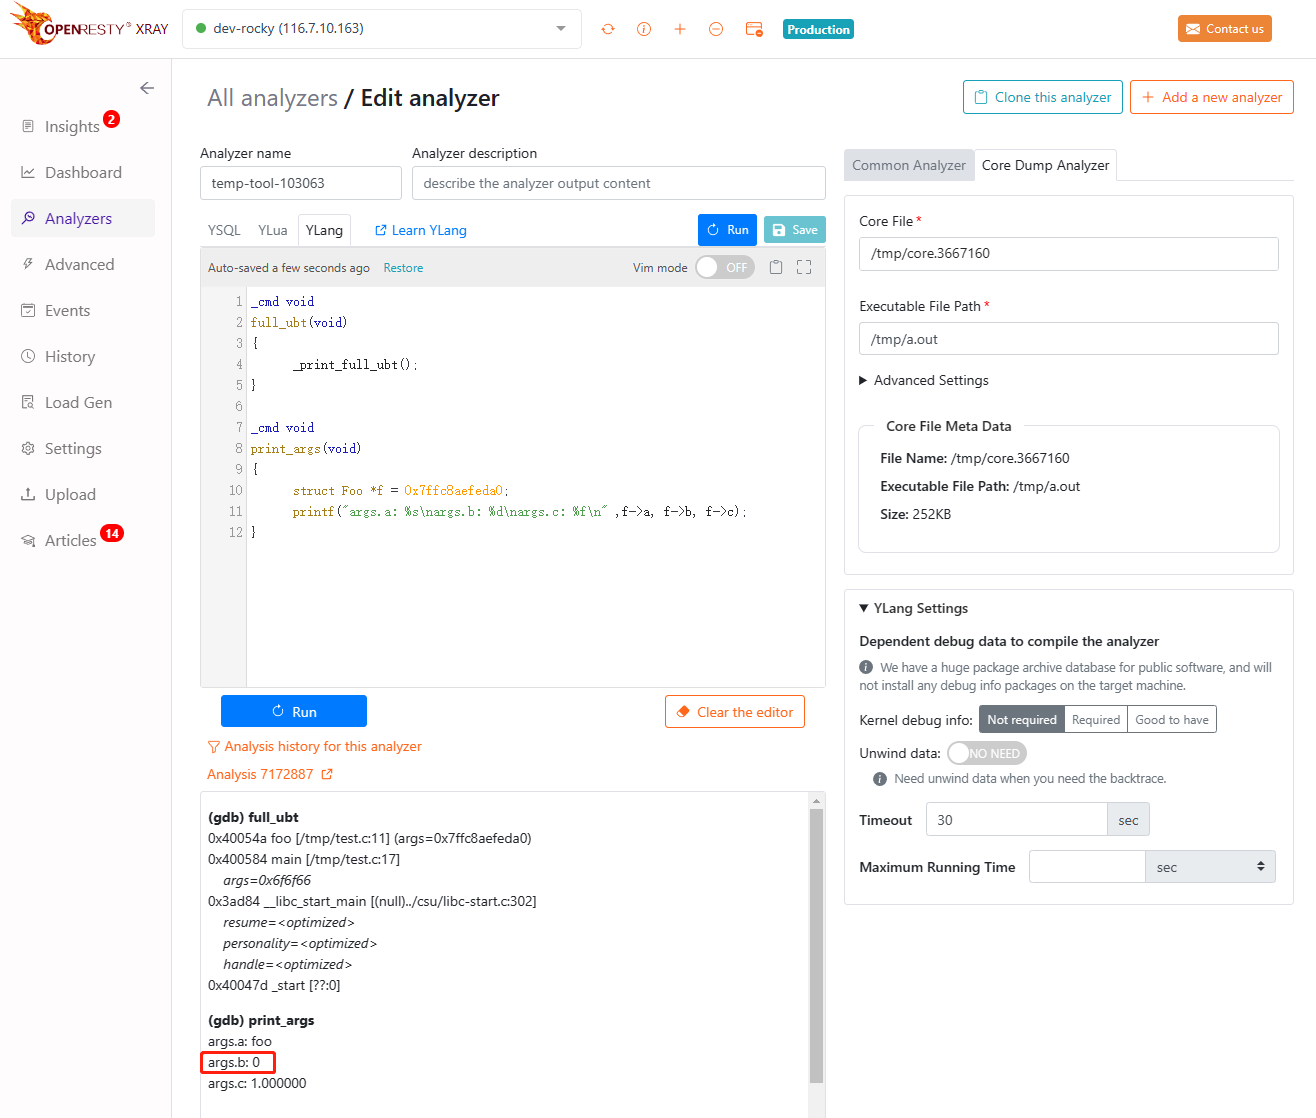
Save and run the analyzer and get the following results:
(gdb) full_ubt
0x40054a foo [/tmp/test.c:11] (args=0x7ffc8aefeda0)
0x400584 main [/tmp/test.c:17]
    args=0x6f6f66
0x3ad84 __libc_start_main [(null)../csu/libc-start.c:302]
    resume=<optimized>
    personality=<optimized>
    handle=<optimized>
0x40047d _start [??:0]

(gdb) print_args
args.a: foo
args.b: 0
args.c: 1.000000
We can see that the value of the member variable b inside is indeed 0, which verifies our guess.
With this simple example above, you have learned how to use YLang to create a custom analyzer to analyze core files, but the actual program exception analysis is much more complex than this example. YLang also provides many other powerful features to help us, see YLang’s syntax documentation.