Monitoring OpenResty Edge
This document provides a comprehensive monitoring solution for OpenResty Edge, helping you track system status in real-time and promptly identify and resolve potential issues.
Monitoring Architecture Overview
The following aspects of OpenResty Edge need to be monitored, listed in order of priority:
- Configuration Synchronization Monitoring: Ensure configurations are correctly synchronized to all nodes
- Application-level Monitoring: Monitor the status of Edge Admin, Edge Node, Edge Log Server, and other components
- System-level Monitoring: CPU, memory, disk, network, and other basic resource monitoring
- Error Log Monitoring: Error log collection and analysis
- Business-level Monitoring: Request volume, response time, error rate, and other business metrics
Message Notifications in OpenResty Edge
OpenResty Edge has a built-in powerful notification mechanism that can push system status changes directly to external systems.
Configuration Documentation References
Supported Alert Types
Supports the following types of message notifications, including but not limited to:
- Gateway node CPU usage greater than 80%
- Gateway node memory usage greater than 90%
- Gateway node log disk usage greater than 90%
- Gateway node heartbeat status changes
- Gateway node health check status changes
- New configuration deployment
Synchronization Status Monitoring
Configuration synchronization is a core function of OpenResty Edge. Monitoring the synchronization status is essential for ensuring normal system operation.
Prometheus Metrics Monitoring
Enable Prometheus Metrics: Enable Prometheus metrics in Edge Admin
Configure trusted IPs, path: Edge Admin > Global Configuration > Global Metrics > “OpenResty Edge Admin” tab:
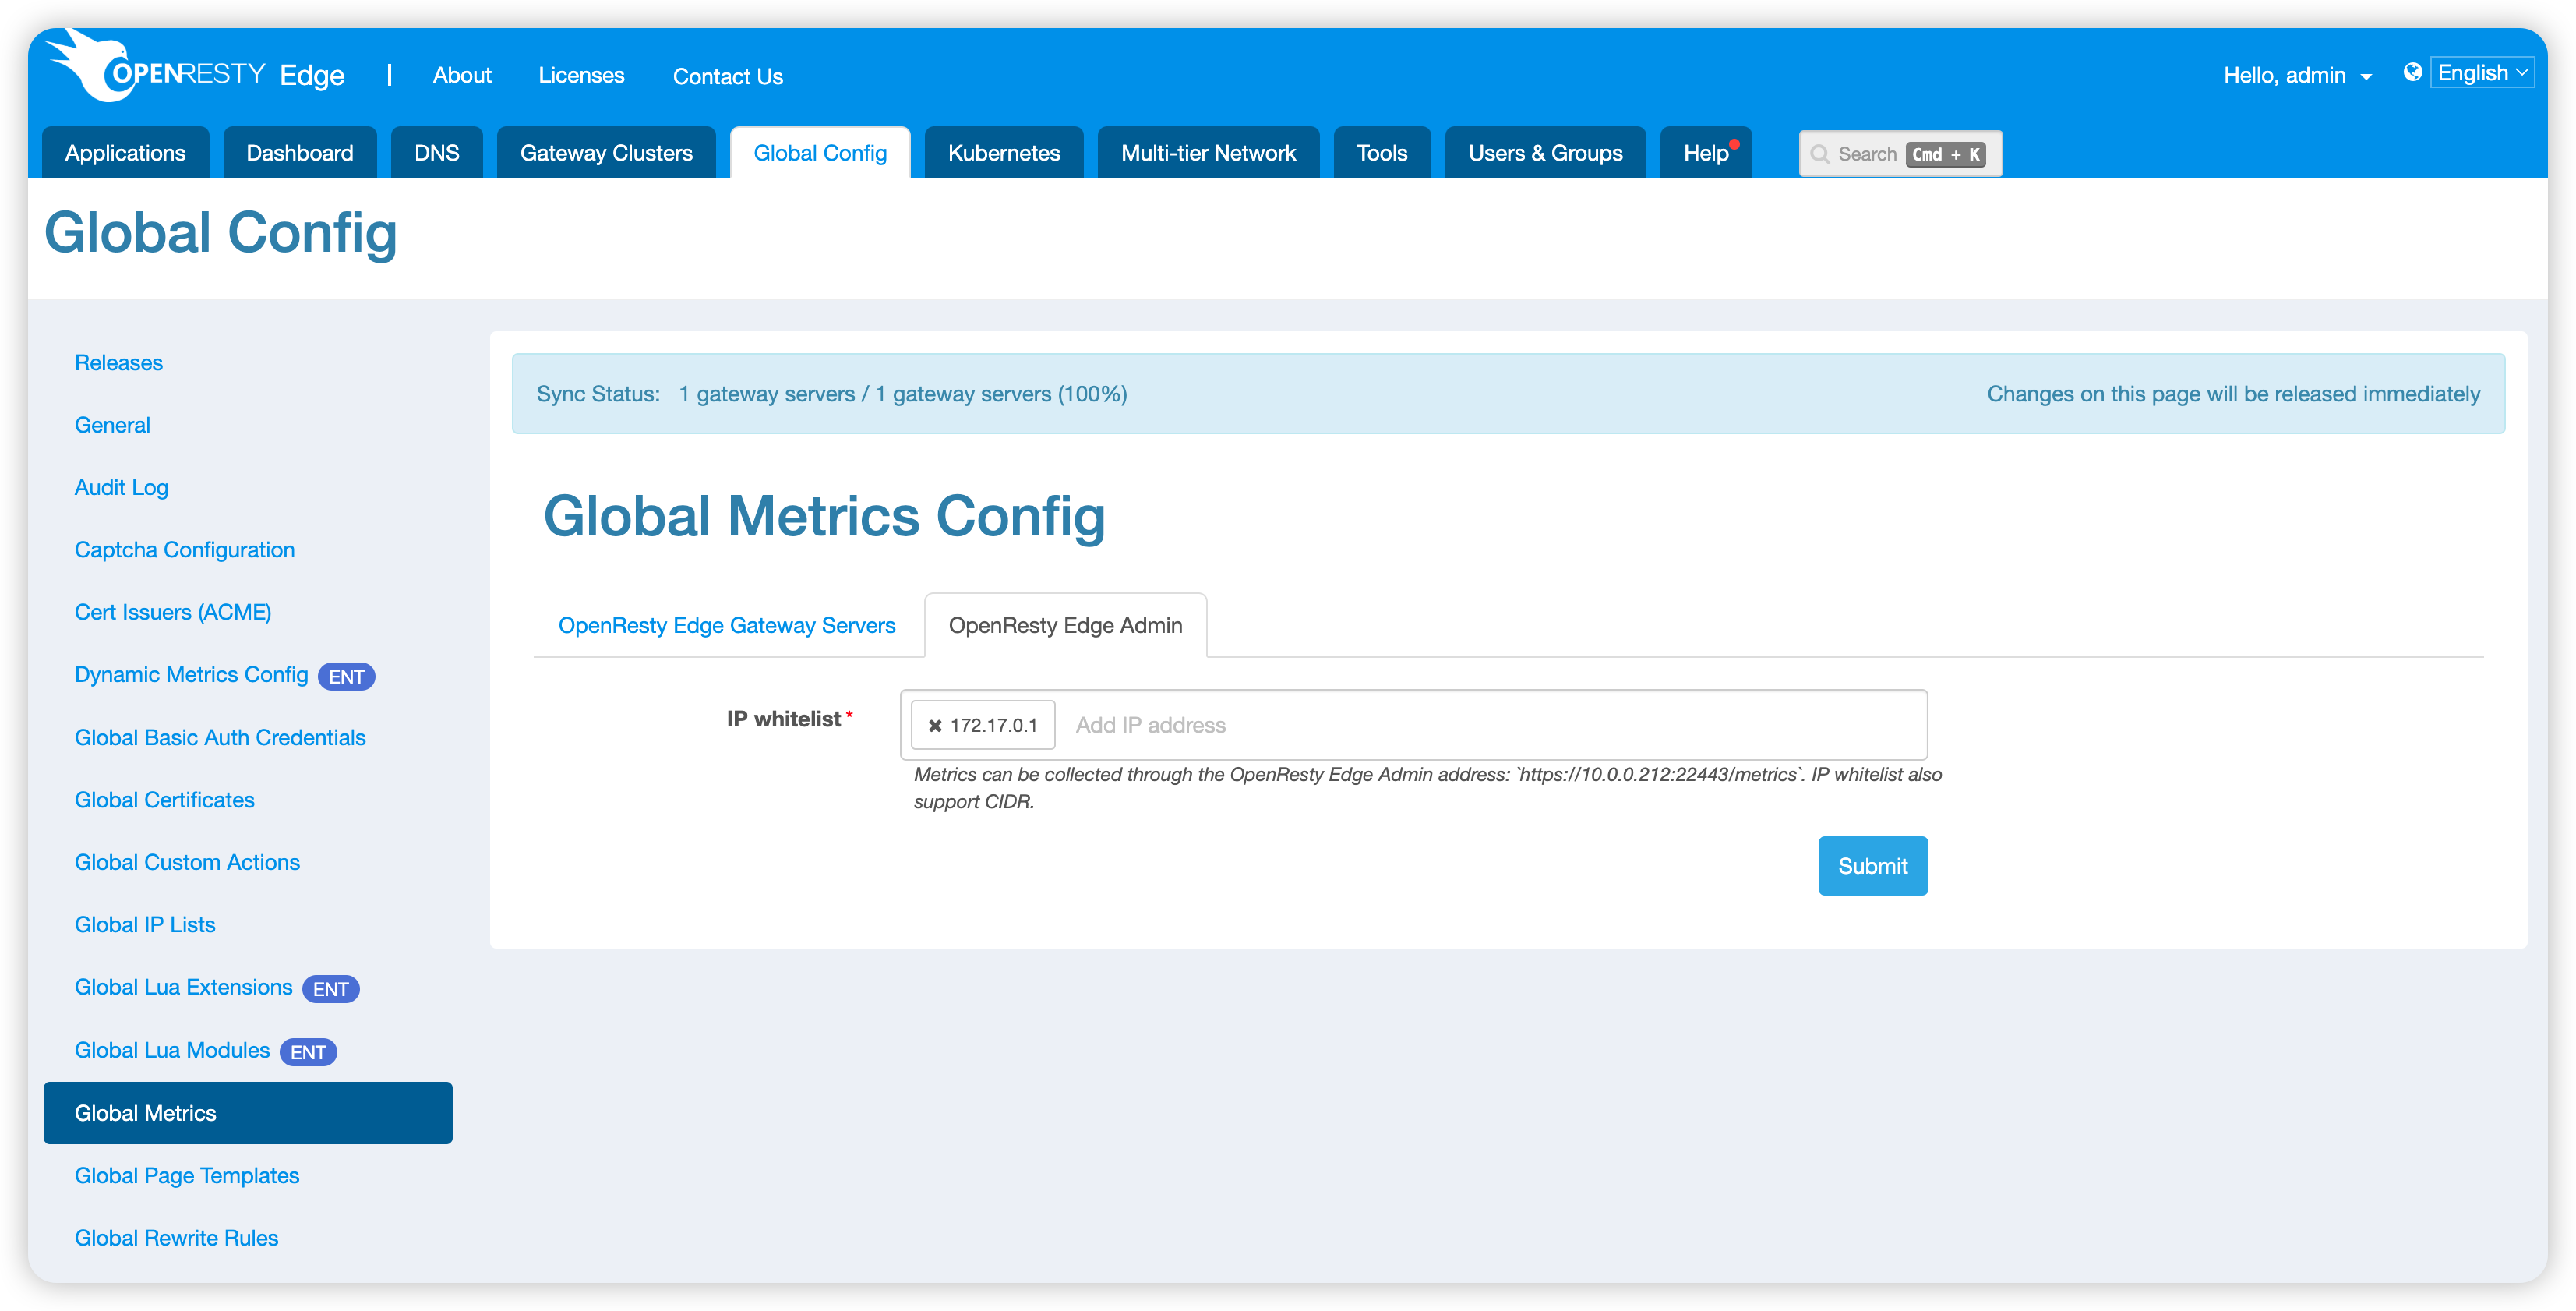
Metrics Output Example:
# HELP service_status Service status
# TYPE service_status gauge
service_status{type="log_server_offline"} 0 1741597233000
service_status{type="log_server_db_offline"} 0 1741597233000
# HELP config_sync_delay Configuration sync delay
# TYPE config_sync_delay gauge
config_sync_delay{hostname="oredge-node-1",internal_ip="172.17.0.6",external_ip="172.17.0.6"} 6 1741597233000
In this example, the Edge Node named “oredge-node-1” is 6 configuration changes behind.
Alert Rule Example:
config_sync_delay > 100Alert when configuration delay exceeds threshold 100 for 5 consecutive minutes
Database Monitoring
OpenResty Edge relies on PostgreSQL database. The following measures are recommended:
High Availability Configuration
Prioritize database high availability configuration. You can refer to the following two documents:
Key Monitoring Metrics
- Connection Count: Monitor the ratio of active connections to maximum connections
- System Resources: CPU usage, disk space usage, memory usage
Database Maintenance
- Regular Backups: Daily full backup of Edge Admin database, regular restoration testing in test environment
- Note: Edge Log Server database does not contain main configurations, cold backups may not be necessary
System Load Monitoring
Monitor the system load of all components of OpenResty Edge to ensure timely detection of faulty services.
Basic Resource Monitoring
| Monitoring Item | Warning Threshold | Alert Threshold | Monitoring Method |
|---|---|---|---|
| CPU Usage | 80% | 90% | Cloud platform monitoring or custom scripts |
| Memory Usage | 85% | 95% | Cloud platform monitoring or custom scripts |
| Disk Usage | 80% | 90% | Cloud platform monitoring or custom scripts |
| Network Bandwidth Usage | 80% | 90% | Cloud platform monitoring or custom scripts |
You can use monitoring services provided by AWS, GCP, Alibaba Cloud, Azure, or other cloud providers, or write your own scripts for periodic monitoring.
Error Log Monitoring
OpenResty Edge collects its own error logs, which you can view through Edge Admin > Dashboard > Error Logs. However, OpenResty Edge currently does not provide an alert mechanism for its own errors, so additional alerting is needed for uncommon errors in log files.
Log Collection Paths
Use tools like Filebeat to collect logs from the following paths:
| Component | Error Log Path |
|---|---|
| Edge Admin | /usr/local/oredge-admin/logs/error.log |
| Edge Node | /usr/local/oredge-node/logs/error.log |
| Edge Log Server | /usr/local/oredge-log-server/logs/error.log |
Log Alert Strategy
- Filter out logs generated by normal operations such as log rotation and configuration hot updates
- Focus on and alert for exceptional situations such as stack traces
Business Monitoring
You can use the following two methods to monitor your business:
Access Log Analysis
Collect and analyze access logs from the following paths:
| Component | Access Log Path |
|---|---|
| Edge Admin | /usr/local/oredge-admin/logs/access.log |
| Edge Node | /usr/local/oredge-node/logs/access.log |
| Edge Log Server | /usr/local/oredge-log-server/logs/access.log |
Analyze QPS, request status distribution, URI distribution, etc. through access logs.
Dynamic Metrics Monitoring
Enable dynamic metrics in OpenResty Edge as needed.
Note: Enabling dynamic metrics may cause the Edge Log Server database to consume a large amount of disk space. Please ensure that the device hosting the Edge Log Server database has sufficient disk space.
Common Troubleshooting Guide
Configuration Synchronization Issues
Symptom: Edge Node configuration synchronization delay is large
Possible Causes:
- Unstable network connection between Edge Node and Edge Admin
- High load on Edge Admin database
- High load on Edge Node, slow processing of synchronization requests
- Edge Node offline for too long, losing synchronization
- Edge Admin configuration changes too quickly, incremental sync configurations are cleared, Edge Node fails to perform incremental synchronization
Troubleshooting Steps:
- Check Edge Admin and Edge Node logs
- Check network connection status
- Check database performance metrics
Database Issues
Symptom: Edge Admin or Edge Log Server responds slowly
Possible Causes:
- Large database table data volume causing query performance degradation
- Poor network connection status
- Insufficient database space
- Too many connections
- PostgreSQL database is performing space optimization tasks
Troubleshooting Steps:
- Check Edge Admin and Edge Node logs
- Use psql to log into the database and analyze table space usage
- Check disk space usage