Dynamic Metrics
Global dynamic metrics can dynamically aggregate the data you want by writing Metrics SQL.
More Metrics SQL details can be found in this documentation. Metrics SQL
Global Dynamic Metrics
Global dynamic metrics integrate global data, such as statistics on current gateway cache hit rates, upstream and downstream traffic sizes, distribution of request status codes, etc.
Unlike the application dynamic metrics, the global dynamic metrics provide a filter item for gateway services that allows you to view data for each gateway service.
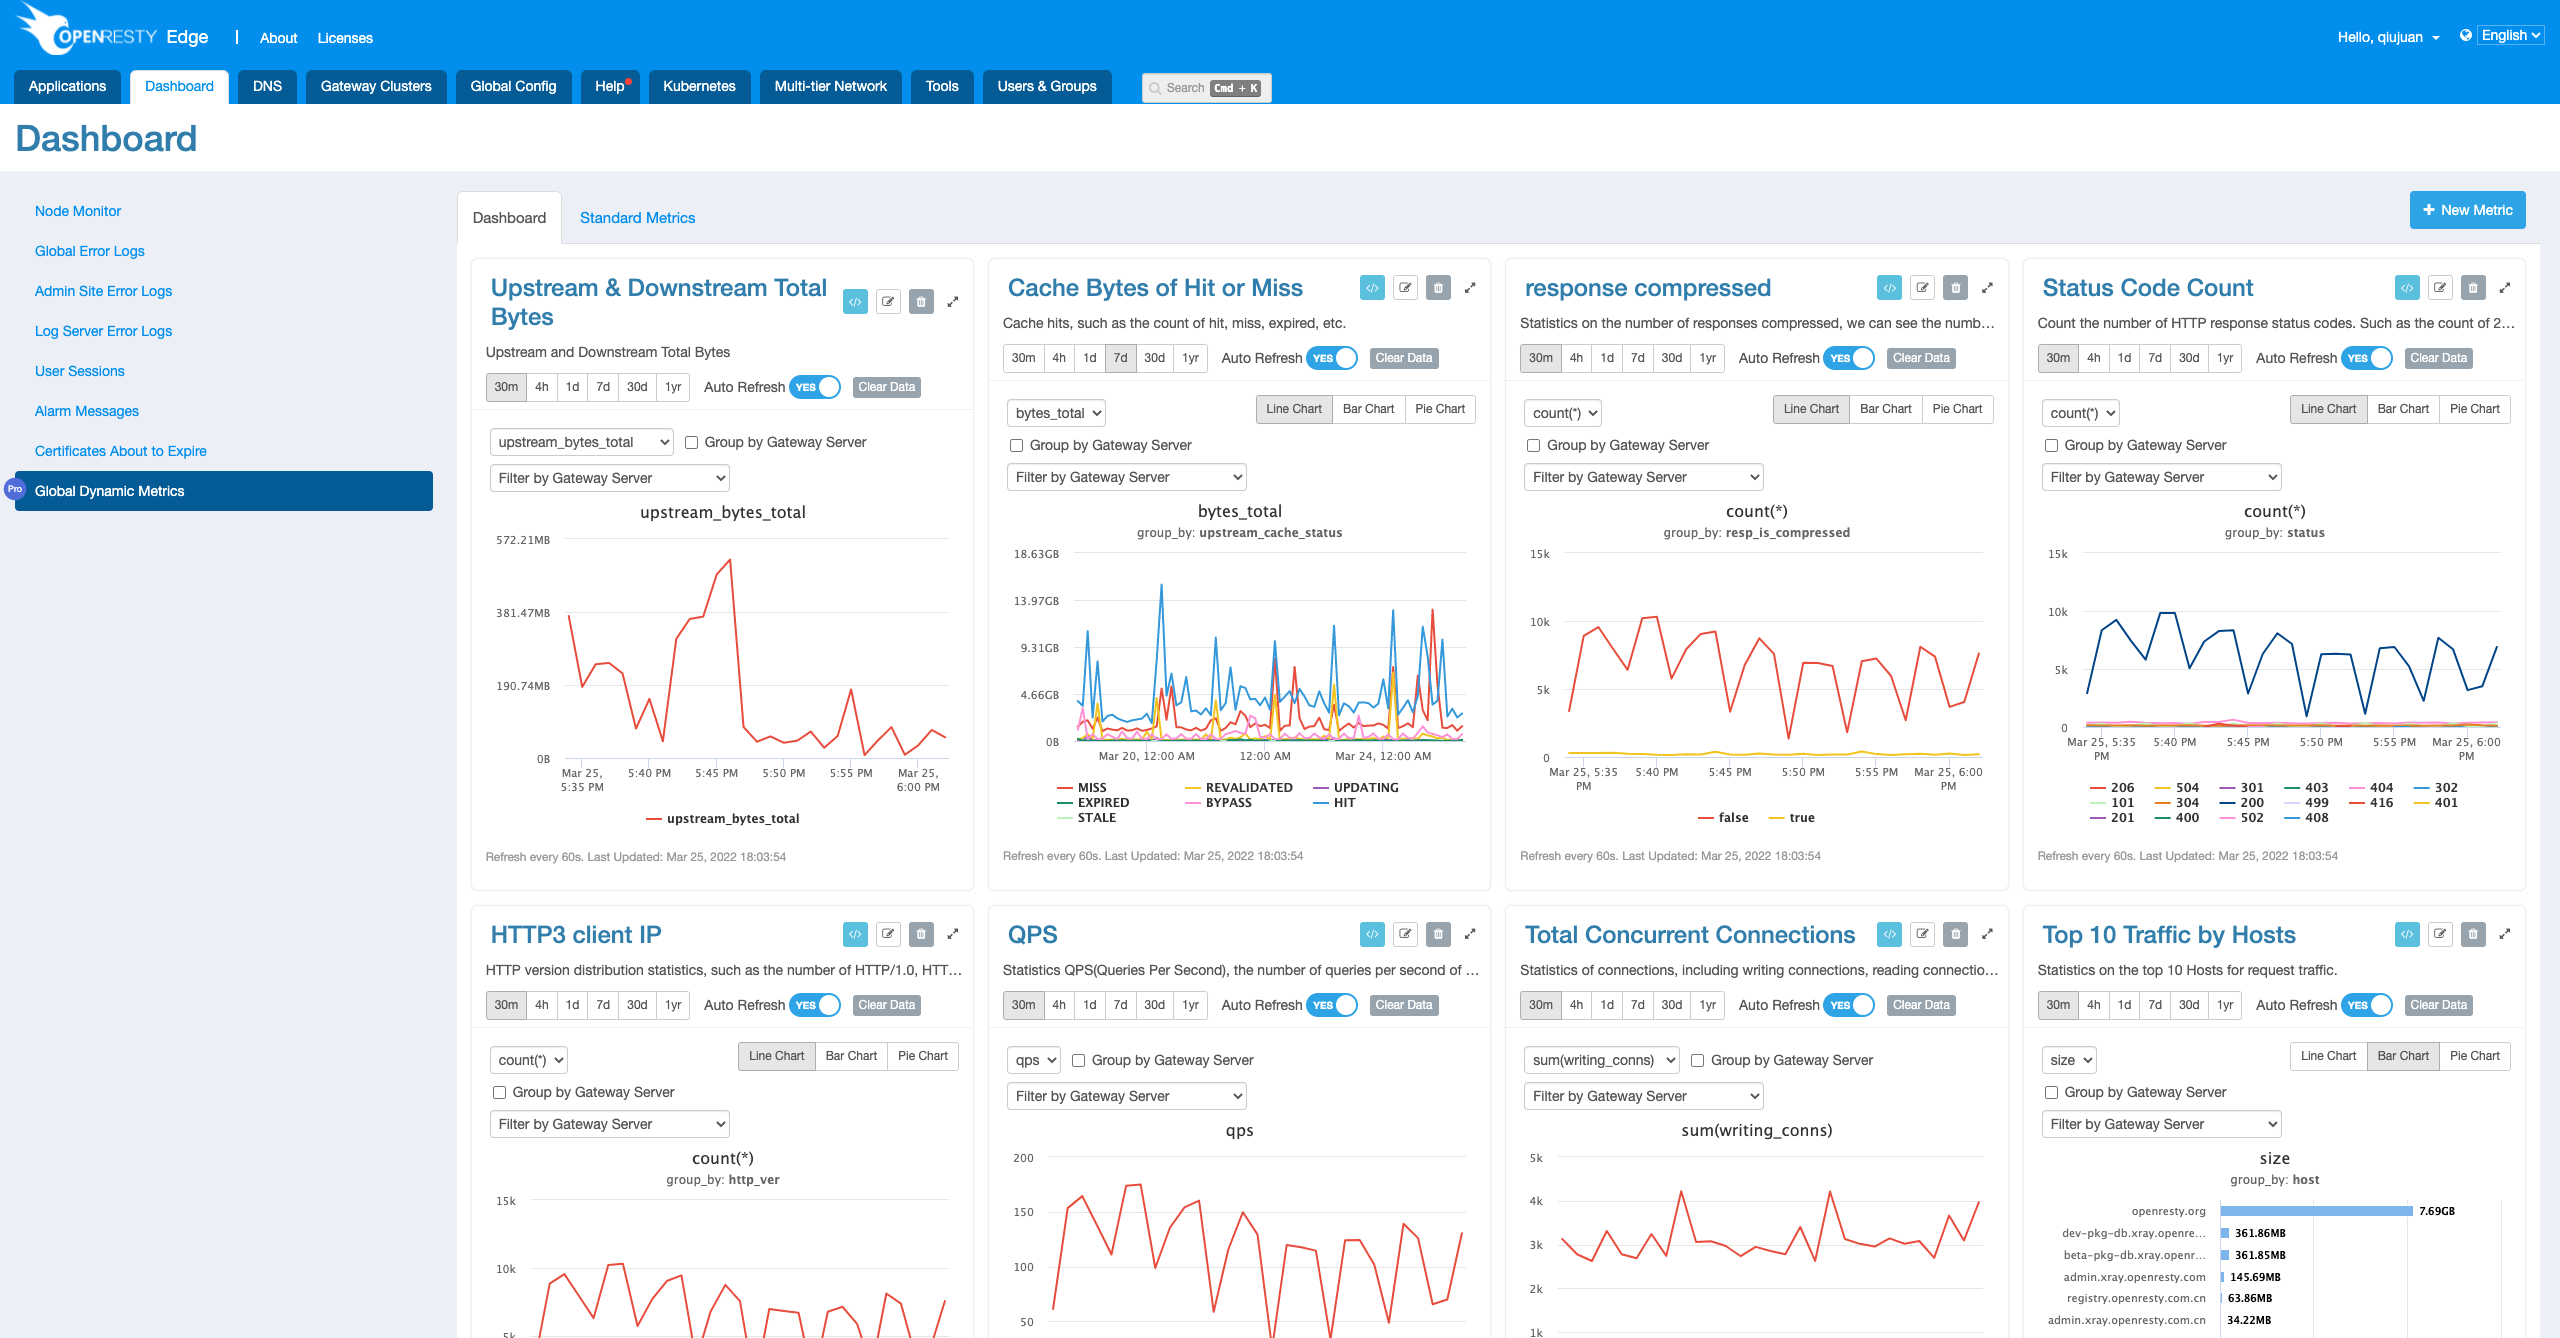
We can create a dynamic metric manually by clicking the “New Metric” button, or we can directly enable some metrics in the standard dynamic metrics.

Adding a dynamic metric allows us to write our own Metric SQL to dynamically aggregate the desired data.
More Metrics SQL details can be found in this documentation. Metrics SQL
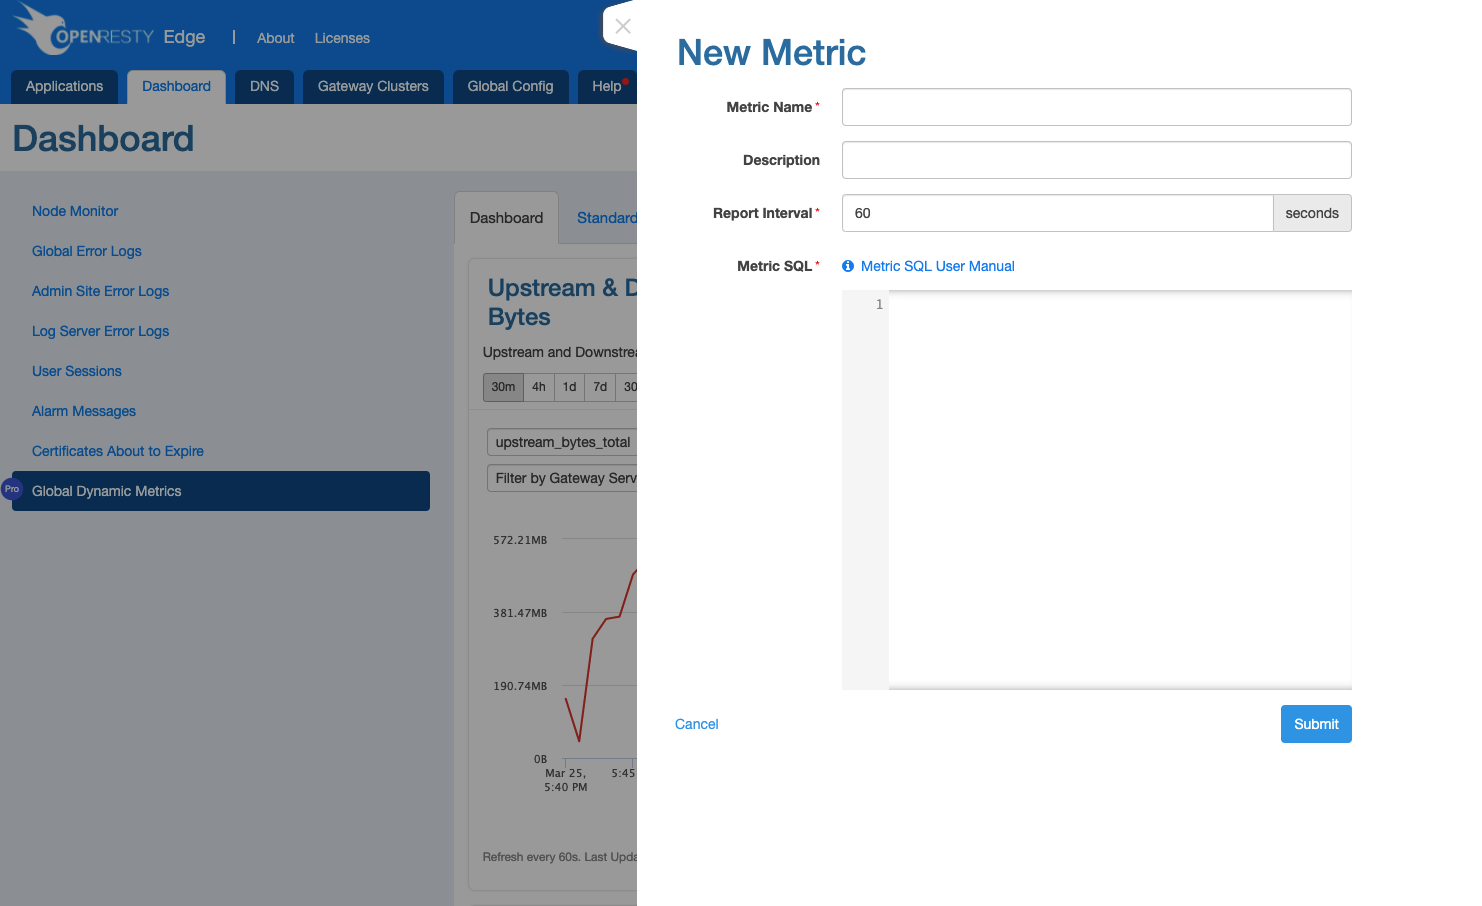
For new and newly enabled dynamic metrics, it takes one to two minutes for the data to become available.
Global Standard Dynamic Metrics
Global standard dynamic metrics aggregates many commonly used dynamic metrics statistics, greatly reducing the cost of manual creation for everyone.
The following is a detailed description of each of the global standard dynamic metrics.
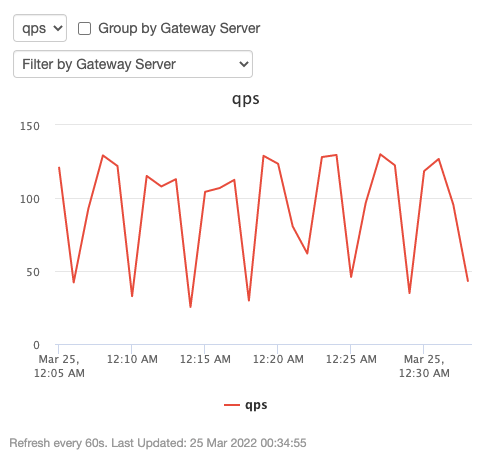
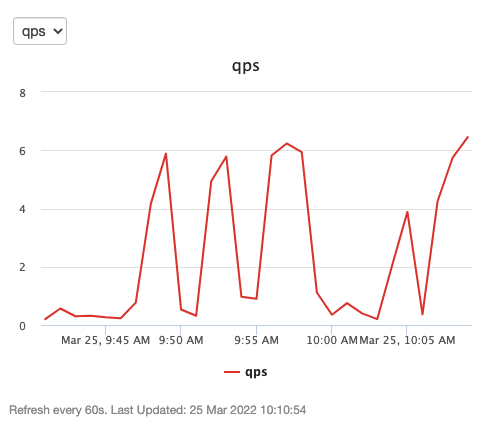
Request Count per Second
Statistics QPS(Queries Per Second), the number of request per second of the servers.
select count(*) /60.0 as qps from http;
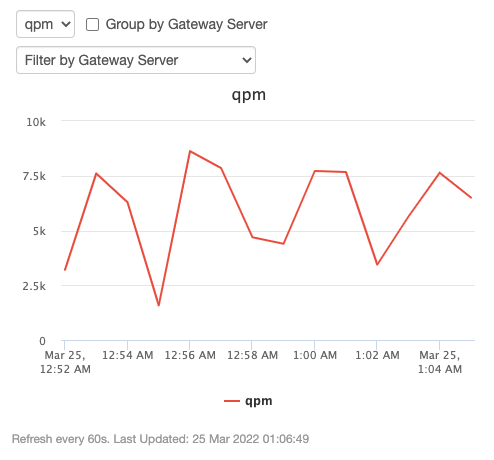
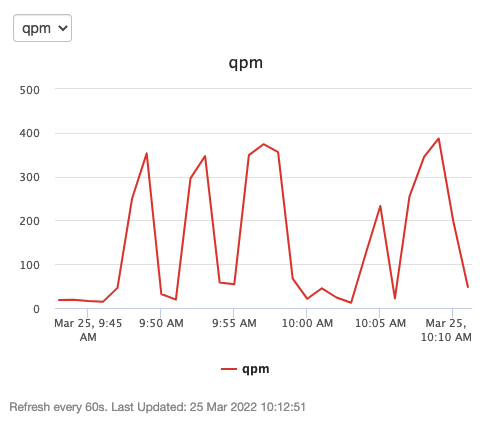
Request Count per Minute
Statistics on the number of request per minute of the servers.
select count(*) as qpm from http;
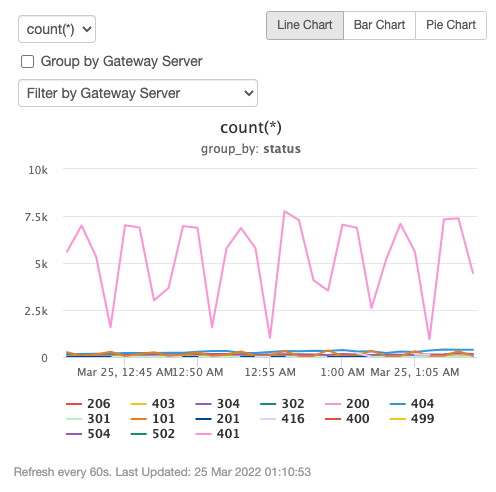
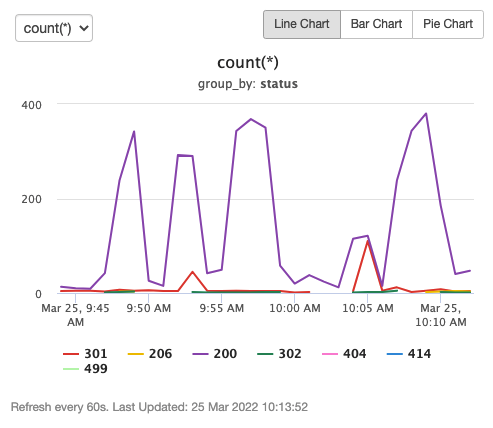
Status Code Distribution
Count the number of HTTP response status codes. Such as the count of 200, 301, 404, 500, etc.
select status, count(*) from reqs group by status;
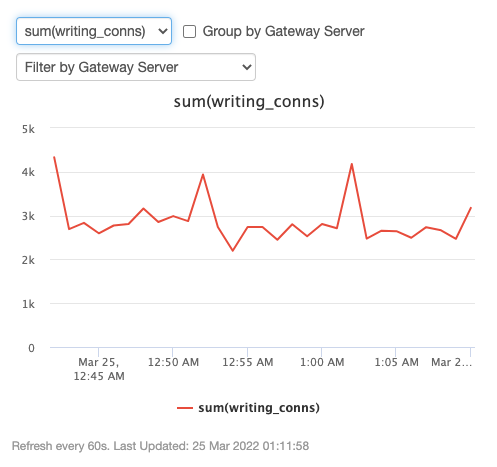
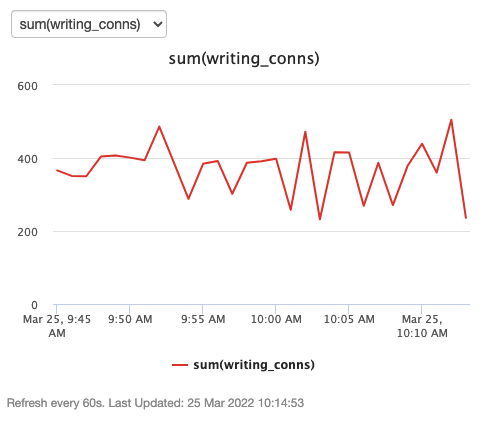
Total Concurrent Connections
Statistics of connections, including writing connections, reading connections, waiting connections and active connections.
select sum(writing_conns), sum(reading_conns), sum(waiting_conns), sum(active_conns)
from http;
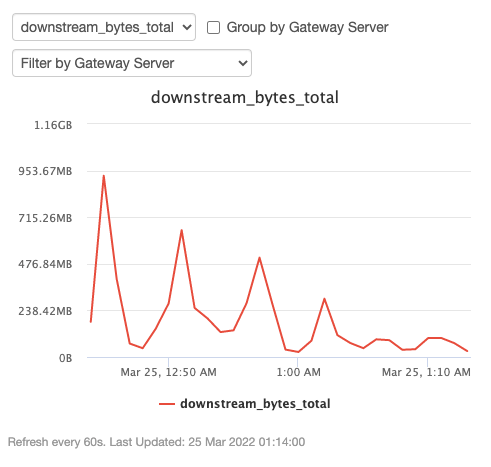
Downstream Total Bytes
Statistics total bytes of downstream.
select sum(total_size) as downstream_bytes_total
from reqs;
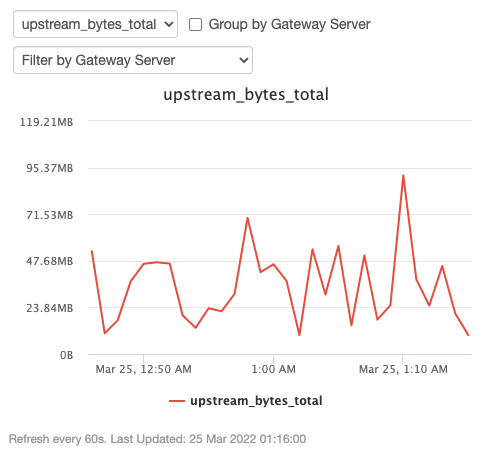
Upstream Total Bytes
Statistics total bytes of upstream.
select sum(upstream_byte_total) as upstream_bytes_total
from reqs;
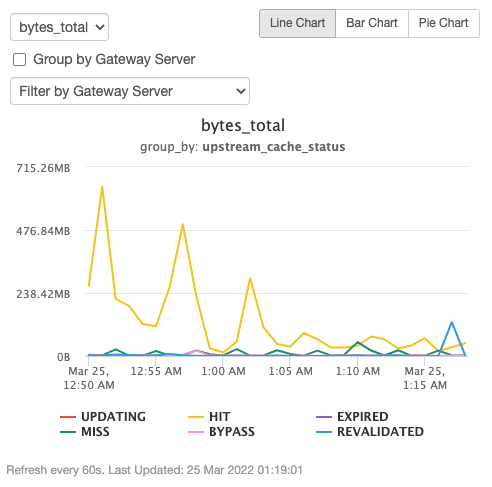
HTTP Proxy Cache Hits & Misses
Statistics HTTP proxy cache hits & misses, such as the count of hit, miss, bypass, updating, revalidated, stale, expired, etc.
select sum(total_size) as bytes_total, upstream_cache_status, count(*)
from reqs
where upstream_cache_status != ''
group by upstream_cache_status;
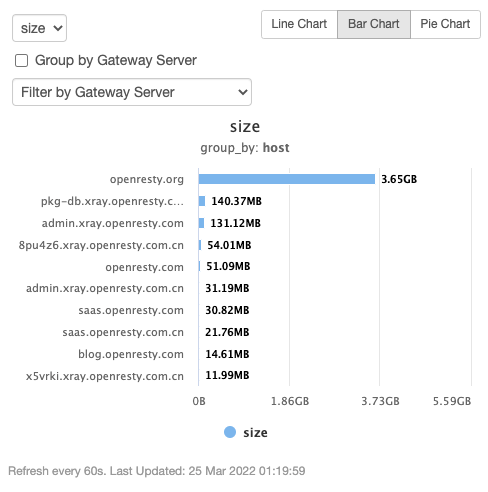
Top 10 Hosts by Traffic Data Size
Statistics of the top 10 hosts by traffic data size.
select host, sum(total_size) as size
from reqs
group by host
order by size desc
limit 10;
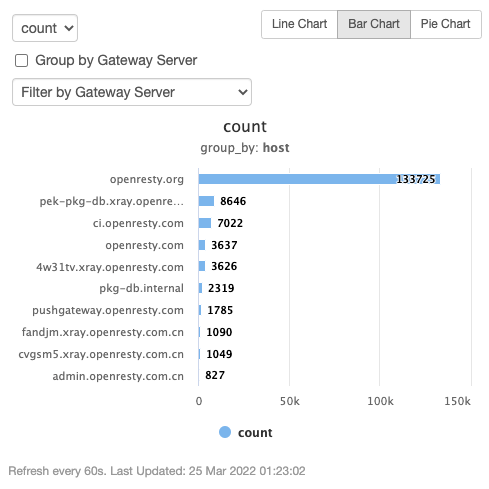
Top 10 Hosts by Request Counts
Statistics of the top 10 hosts by request counts.
select host, count(*) as count
from reqs
group by host
order by count desc
limit 10;
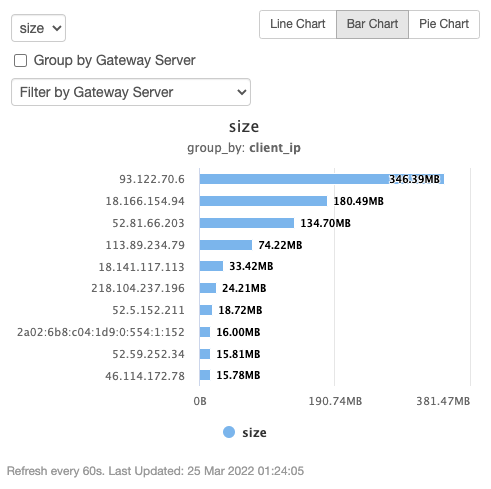
Top 10 Client IPs by Traffic Data Size
Statistics of the top 10 request client IPs by traffic data size.
select client_ip, sum(total_size) as size
from reqs
group by client_ip
order by size desc
limit 10;
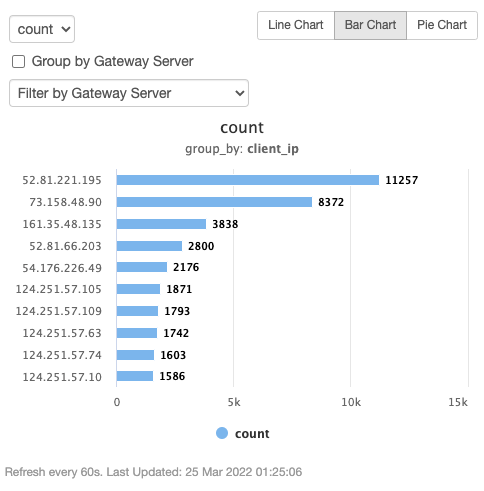
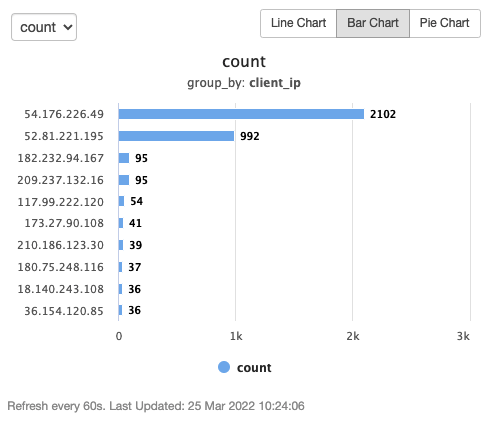
Top 10 Client IPs by Request Counts
Statistics of the top 10 client IPs by request counts.
select client_ip, count(*)  as count
from reqs
group by client_ip
order by count desc
limit 10;
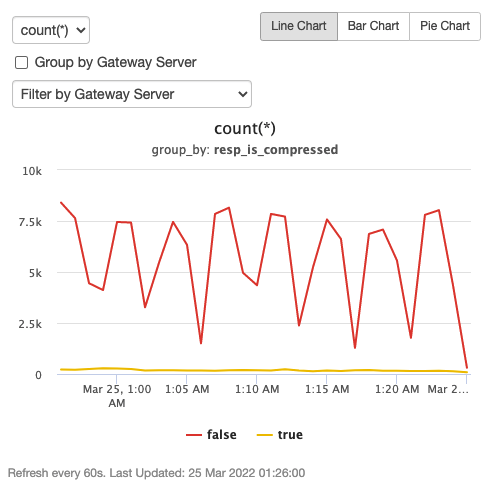
Response Compressed
Statistics on the number of responses compressed, we can see the number of compressed and the number of uncompressed.
select resp_is_compressed, count(*)
from reqs
group by resp_is_compressed;
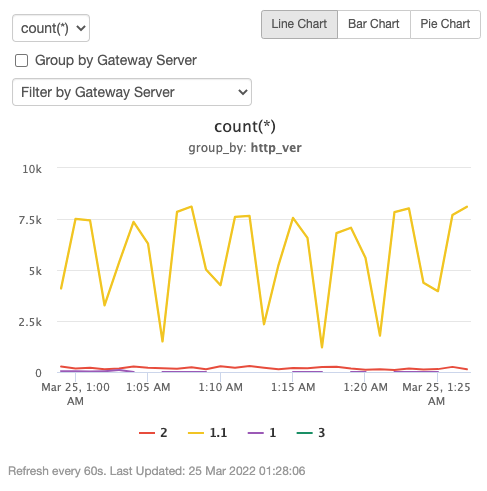
HTTP Versions
HTTP versions distribution statistics, such as the number of HTTP/1.0, HTTP/1.1, HTTP/2, HTTP/3, etc.
select http_ver, count(*)
from reqs
group by http_ver;
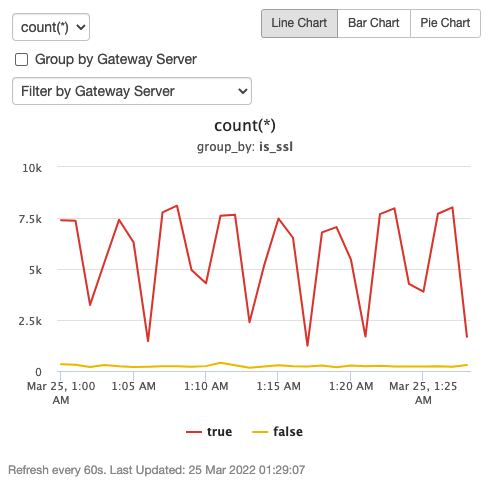
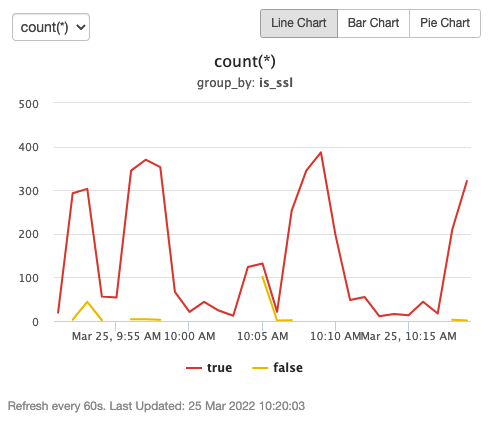
SSL Encrypted Connections
Statistics on the distribution of SSL encrypted connections.
select is_ssl, count(*)
from reqs
group by is_ssl;
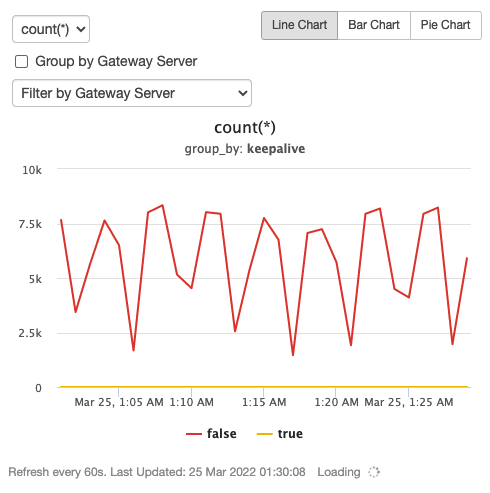
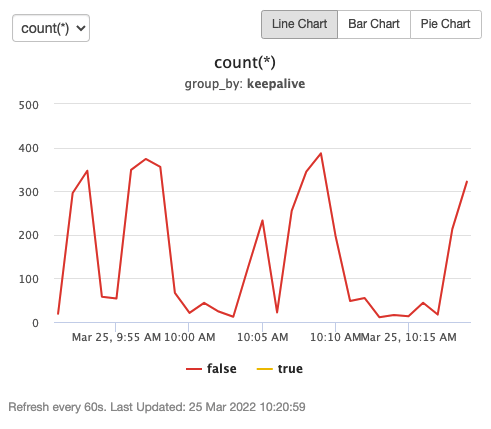
Keepalive Connections
Statistics on the distribution of keepalive connections.
select keepalive, count(*)
from reqs
group by keepalive;
Application Dynamic Metrics
Application dynamic metrics are similar to global dynamic metrics, but will only count requests that currently belong to the application.
Application dynamic metrics, like global dynamic metrics, can also be used to manually write metrics SQL to dynamically aggregate the desired data, or to directly enable some metrics in the standard dynamic metrics.
More Metrics SQL details can be found in this documentation. Metrics SQL


Application Standard Dynamic Metrics
Application standard dynamic metrics aggregates many commonly used dynamic metrics statistics, greatly reducing the cost of manual creation for everyone.
Application standard dynamic metrics are similar to global dynamic metrics, but will only count requests that currently belong to the application.
The following is a detailed description of each of the standard dynamic metrics.
Request Count per Second
Statistics QPS(Queries Per Second), the number of request per second of the servers.
select count(*) /60.0 as qps from http;
Request Count per Minute
Statistics on the number of request per minute of the servers.
select count(*) as qpm from http;
Status Code Distribution
Count the number of HTTP response status codes. Such as the count of 200, 301, 404, 500, etc.
select status, count(*) from reqs group by status;
Total Concurrent Connections
Statistics of connections, including writing connections, reading connections, waiting connections and active connections.
select sum(writing_conns), sum(reading_conns), sum(waiting_conns), sum(active_conns)
from http;
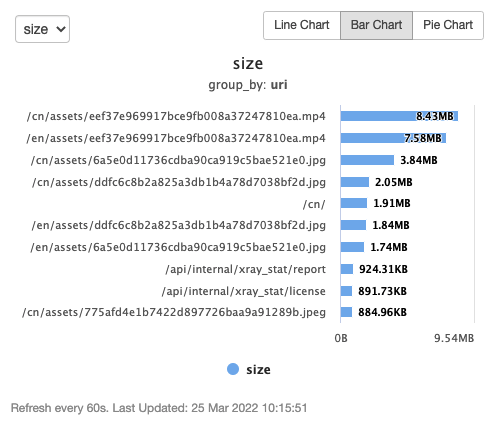
Top 10 URIs by Traffic Data Size
Statistics of the top 10 request URIs by traffic data size.
select uri, sum(total_size) as size
from reqs
group by uri
order by size desc
limit 10;
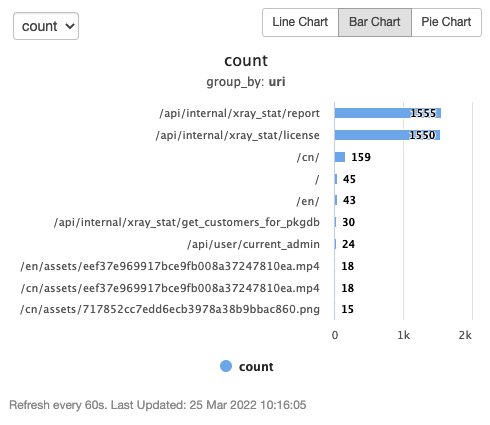
Top 10 URIs by Request Counts
Statistics of the top 10 URIs by request counts.
select uri, count(*) as count
from reqs
group by uri
order by count desc
limit 10;
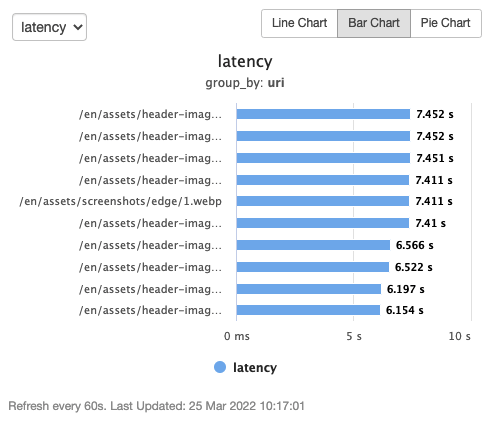
Top 10 URIs by Average Latency
Statistics of the top 10 URIs in terms of average latency.
select uri, avg(latency_ms) as latency
from reqs
group by uri
order by latency desc
limit 10;
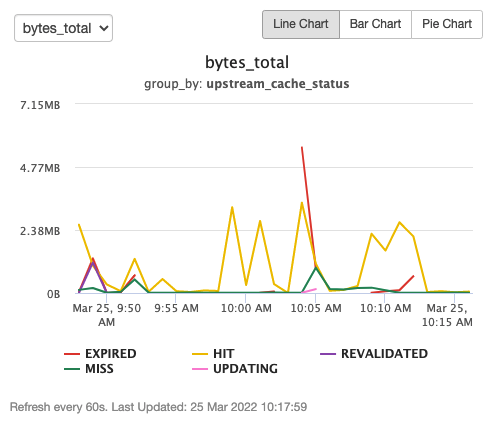
HTTP Proxy Cache Hits & Misses
Statistics HTTP proxy cache hits & misses, such as the count of hit, miss, bypass, updating, revalidated, stale, expired, etc.
select sum(total_size) as bytes_total, upstream_cache_status, count(*)
from reqs
where upstream_cache_status != ''
group by upstream_cache_status;
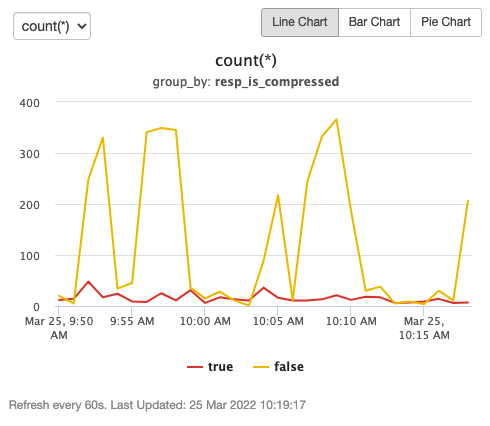
Response Compressed
Statistics on the number of responses compressed, we can see the number of compressed and the number of uncompressed.
select resp_is_compressed, count(*)
from reqs
group by resp_is_compressed;
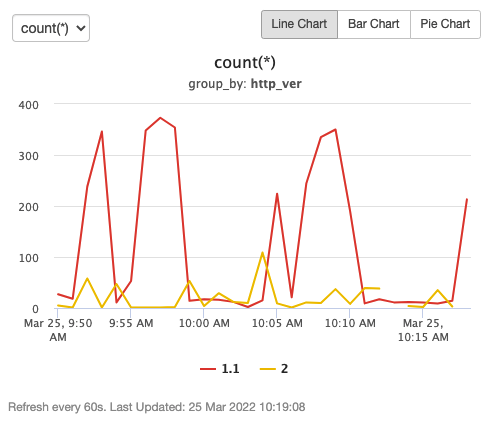
HTTP Versions
HTTP versions distribution statistics, such as the number of HTTP/1.0, HTTP/1.1, HTTP/2, HTTP/3, etc.
select http_ver, count(*)
from reqs
group by http_ver;
SSL Encrypted Connections
Statistics on the distribution of SSL encrypted connections.
select is_ssl, count(*)
from reqs
group by is_ssl;
Keepalive Connections
Statistics on the distribution of keepalive connections.
select keepalive, count(*)
from reqs
group by keepalive;
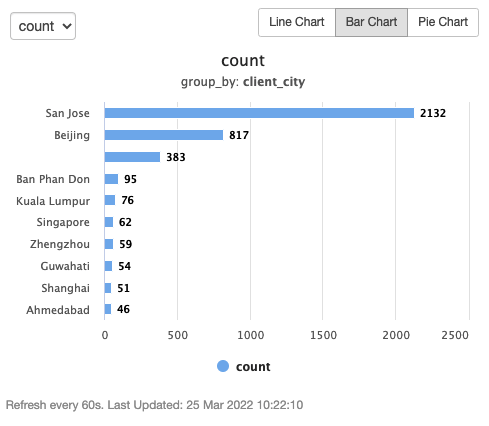
Top 10 Client Cities by Traffic Data Size
Statistics of the top 10 client cities by traffic data size.
select client_city, count(*) as count
from reqs
group by client_city
order by count desc
limit 10;
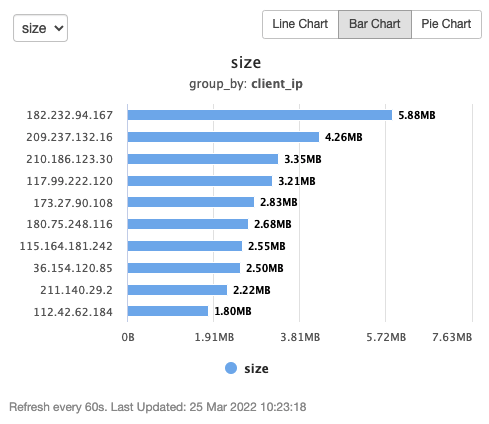
Top 10 Client IPs by Traffic Data Size
Statistics of the top 10 client IPs by traffic data size.
select client_ip, sum(total_size) as size
from reqs
group by client_ip
order by size desc
limit 10;
Top 10 Client IPs by Request Counts
Statistics of the top 10 client IPs by request counts.
select client_ip, count(*) as count
from reqs
group by client_ip
order by count desc
limit 10;
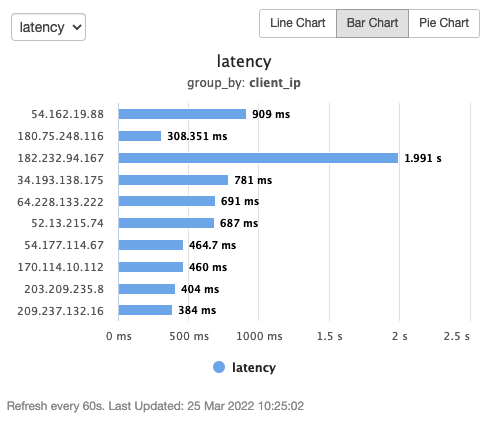
Top 10 Client IPs by Average Latency
Statistics of the top 10 client IPs in terms of average latency.
select client_ip, avg(latency_ms) as latency
from reqs
group by client_ip
order by latency desc
limit 10;
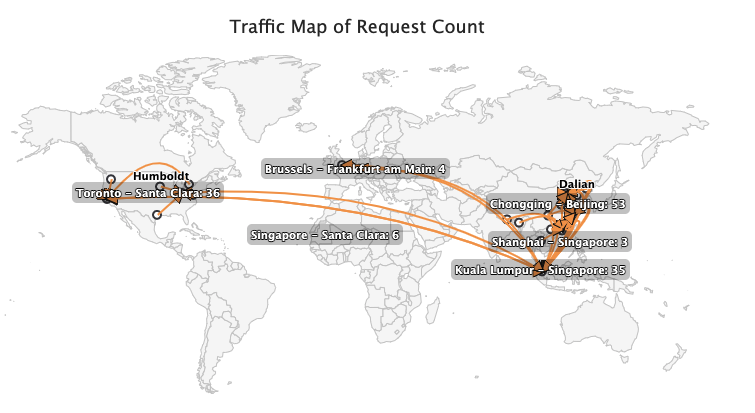
Traffic Map of Request Count
Display global request traffic as a map.
select count(*), client_city, client_latitude, client_longtitude, server_city, server_latitude, server_longtitude
from reqs
group by client_city, client_latitude, client_longtitude, server_city, server_latitude, server_longtitude;
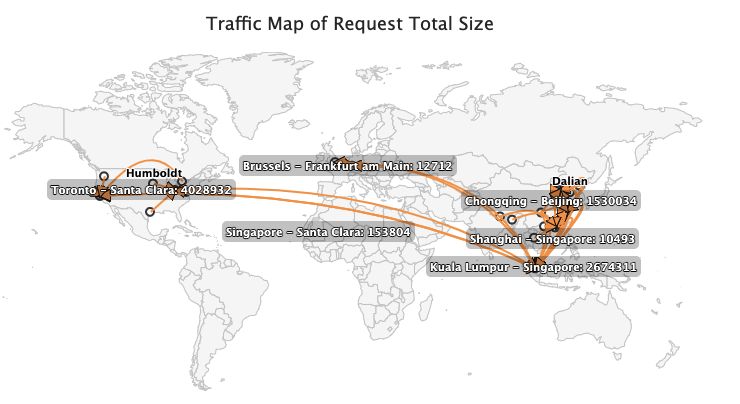
Traffic Map of Request Total Size
Display global request total size as a map.
select sum(total_size), client_city, client_latitude, client_longtitude, server_city, server_latitude, server_longtitude
from reqs
group by client_city, client_latitude, client_longtitude, server_city, server_latitude, server_longtitude;
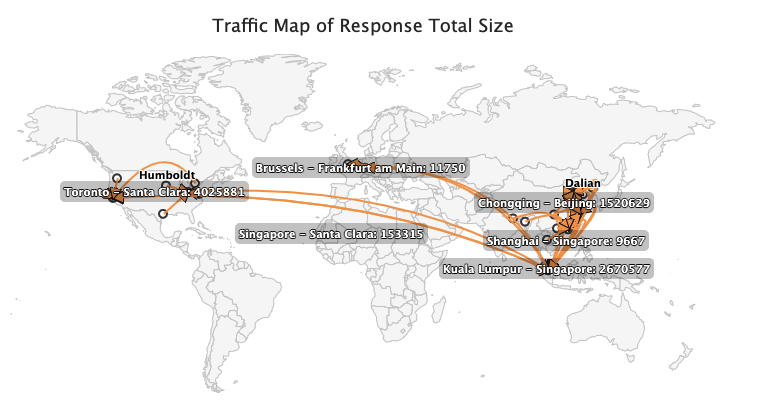
Traffic Map of Response Total Size
Display global response total size as a map.
select sum(resp_size), client_city, client_latitude, client_longtitude, server_city, server_latitude, server_longtitude
from reqs
group by client_city, client_latitude, client_longtitude, server_city, server_latitude, server_longtitude;
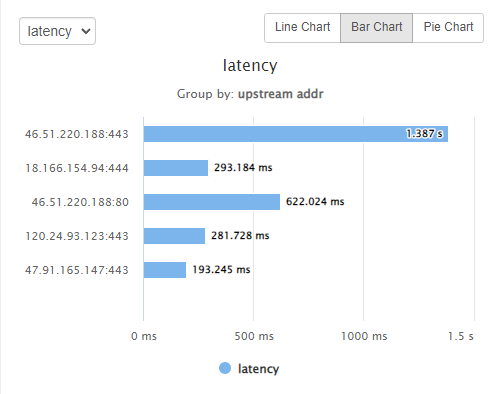
Top 10 Upstream Addresses by Average Latency
Statistics of the top 10 upstream addresses in terms of average latency.
select upstream_addr, avg(upstream_total_time_ms) as latency
from reqs
group by upstream_addr
order by latency desc
limit 10;